Epidemy growth
The model helps to understand the patterns of development of epidemics.
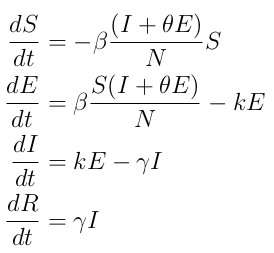
If we divide all people N into groups S - susceptible, E (exposed) - infected in the incubation period, I - infected patients, R - recovered, the epidemic dynamics can be described by SEIR model with equations:

where γ is the speed of recovery,
β is the intensity of contacts with infected,
k is the reciprocal of the incubation period,
θ - coefficient of infectiousness for people during the incubation period (see link).
In this model, the contact intensity factor β is constant, which makes this model somewhat divorced from reality, where various external and self-limiting measures affect the value of the parameter. However, it is in this ideal form that the model is demonstrative!
Change the β coefficient with the slider to see how the duration and the total number of people who have recovered from the epidemic depend.
Based on: https://habr.com/ru/post/500348/
| Oberon & OberonJSSource code | Result |
|
|